For the three months ending June 2026, Steiner Ranch's median home price climbed 2.7 percent year over year to $840,000. For the same general window, reported as of July 2026, the average home price fell 25.3 percent year over year to $785,000. Same neighborhood. Overlapping months. Two headline numbers moving in opposite directions.
That is not a typo and it is not two different neighborhoods getting confused for one another. It is what happens when a price statistic is built from whichever homes happened to close in a given window, in a community that runs from move-up family homes near Steiner Ranch Elementary to gated custom estates along the UT Golf Club fairways. The median in Steiner Ranch has told three different stories in the past eighteen months, and each one had a different cause. None of them was really about whether homes gained or lost value.
A Number That Keeps Changing Its Story
In January 2025, the reported median price in Steiner Ranch jumped 29 percent to $910,000, and the average jumped 31 percent to $996,169. Read on its own, that looks like a sudden surge in what Steiner Ranch homes are worth. The explanation offered in that month's market report was simpler: only 14 homes closed, January typically has the fewest sales of the year, and the ones that did close skewed toward the more expensive sections of the neighborhood, with almost nothing at the entry level. The number moved because the mix of what sold moved, not because a comparable home suddenly commanded 29 percent more.
Three months later, the story flipped. The April 2025 report showed the median down 2.6 percent to $852,000 and the average down 15.7 percent to $918,055, a swing large enough to look like real softening. The actual cause was a base effect: the prior year's comparison period had included two unusually high end sales, which inflated the number being measured against. Prices had not fallen anywhere near that much. The comparison had just gotten harder.
By March 2026, the pattern showed up again, this time with more texture. The entry-level segment was moving briskly, with the lowest available listing at the time priced at $660,000. Meanwhile the top of the market had gone quiet. No home had sold above $2 million since the previous August, and only five homes had closed at $1.5 million or above across that six-month stretch, less than half the count from the same six months a year earlier. February 2026 sales that year ranged from $538,000 to $1,985,000, a spread wide enough that a handful of closings at either end could move the reported median without a single owner's equity actually changing.
Two Price Bands, One ZIP Code
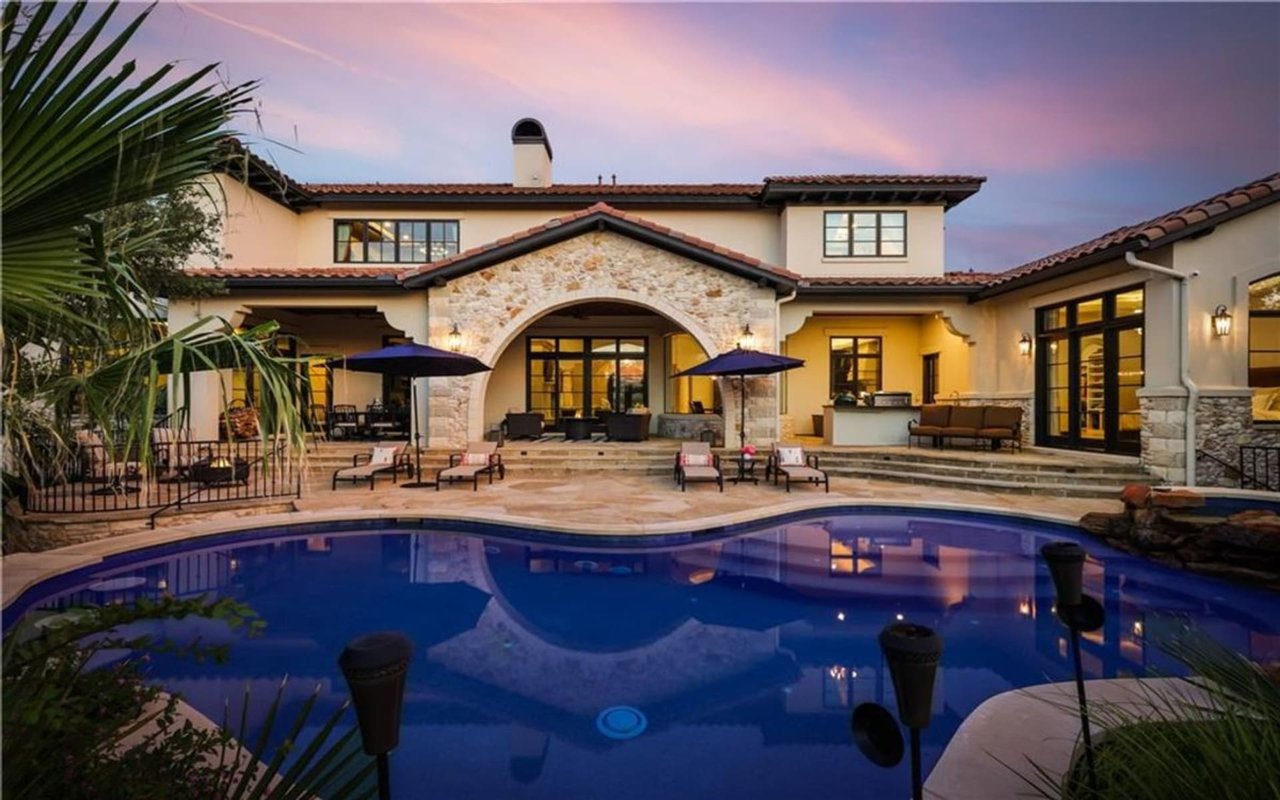
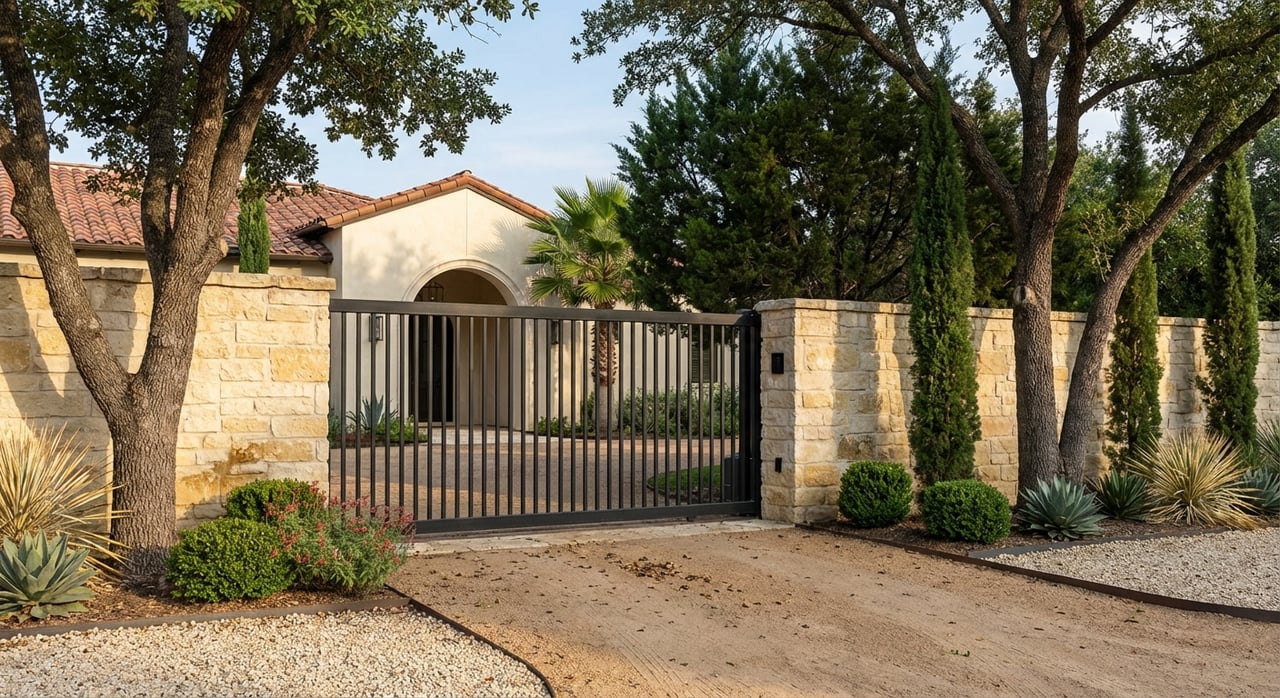
Steiner Ranch spans more than 4,000 acres on the peninsula where Lake Austin meets Lake Travis, and every closing across that footprint reports into the same 78732 ZIP code and the same neighborhood-level statistic. That includes move-up homes near the Lake Club and Steiner Ranch Elementary, and it includes gated sections like The Bluffs, Santaluz, and the Estates of Westridge, where 100-foot homesites and greenbelt views command a different kind of buyer entirely. It also includes the UT Golf Club section, where Q1 2026 listings ranged from $800,000 to more than $3 million on homes between 2,500 and 8,000-plus square feet, served by Leander ISD.
A single blended median cannot distinguish a $900,000 move-up home from a $900,000 golf-course lot with a waitlist for club membership attached to it. Both count the same in the statistic. They do not behave the same in the market.
| Reporting Window | Headline Median | What Was Actually Driving It |
|---|---|---|
| January 2025 | Up 29% to $910,000 | Only 14 closings, nearly all in pricier sections, almost no entry-level sales that month |
| February 2026 (reported March 2026) | Down 0.9% to $840,000 | Entry-level homes selling fast (as low as $660,000) while $1.5M+ sales stalled to just five in six months |
| Three months ending June 2026 | Up 2.7% to $840,000, average down 25.3% for the same general window | Same transactions measured two ways; price per square foot fell 16.7% over that period even as the median ticked up |
What a Falling Average and a Rising Median Can Both Be True
Look past the median for a moment. Over the three months ending June 2026, the median price per square foot in Steiner Ranch was $267, down 16.7 percent year over year, even as the median sale price itself rose 2.7 percent. That is the mix effect showing up in a second measurement. If price per square foot is falling while the median price rises, buyers that period were getting more square footage for the money, which usually means the mix of what sold shifted toward larger homes in a lower price tier, not that smaller homes suddenly became more valuable per foot.
A broader Austin-area analysis of sales through August 2026 made the same point about the metro as a whole, where median price per square foot had fallen 6.0 percent year over year. Median sale price, the analysis noted, moves whenever the mix of homes selling changes, while price per square foot filters most of that noise out. It is the less flattering number in a market like this one, and the more honest one.
Looking at the fuller year, the 12 months ending August 2026 showed 185 homes sold in Steiner Ranch at a median price of $824,000 and a median size of 3,221 square feet. That figure sits between the swings described above, which is exactly what a full year of closings should do: smooth out the month-to-month noise that made January 2025 and February 2026 look like they were telling opposite stories.
The Luxury Segment Behaves Like a Separate Market
The five homes that closed at $1.5 million or above during the six months covered in the March 2026 report were not slow because Steiner Ranch's luxury inventory lost appeal. They were slow because that band is thin. When a data set that small is the only thing available to price against, every closing carries outsized weight, and every month without a closing looks like a gap in demand rather than a normal pause in a market with few transactions to begin with.
That thin upper band includes most of what makes The Bluffs, Santaluz, and the UT Golf Club section distinct: golf course frontage, larger lots, and in the golf club's case, a separate private membership layered on top of the home purchase itself. Pricing a home in that segment against the blended neighborhood median is close to meaningless. The comparable set is a handful of custom estates, not the 71 homes that closed neighborhood-wide in June 2026.
What This Means When You're Comparing Neighborhoods
If a market snapshot hands you a single median for Steiner Ranch, the first question worth asking is how many transactions built that number and over what window. A month with 14 to 20 closings across a 4,000-acre community that spans entry-level homes to $3 million estates will swing based on which handful of properties happened to close, not because comparable homes changed value.
The second question is whether price per square foot agrees with the median. When the two move in different directions, as they did over the three months ending June 2026, that is a signal about mix, not a signal about worth.
The third question, for anyone weighing Steiner Ranch against West Lake Hills, Barton Creek, or Spanish Oaks, is whether the comparison is happening within matching price bands. A $900,000 home in one of Steiner Ranch's move-up sections and a $900,000 listing along the UT Golf Club are different housing products serving different buyers, even though both report through the same ZIP code and the same monthly statistic.
A Few Direct Answers
Does a falling median mean Steiner Ranch homes are losing value? Not on its own. The April 2025 report showed a median decline that traced back to a base effect from two unusually high end sales in the prior year's comparison period, not to actual depreciation. Any single month's move needs the underlying transaction count and mix checked before it means anything about value.
Why do average price and median price sometimes move in opposite directions here? The average is pulled by whichever handful of very high or very low sales happened to close, while the median simply reflects the midpoint of that month's transactions. When the top or bottom of the range is thin, as it has been in Steiner Ranch's $1.5 million-plus segment, the two numbers can diverge sharply even though they're describing the same window, as they did across the period ending June and July 2026.
How do I get a read that actually applies to my price range? Ask for the data segmented by price tier rather than blended across the whole neighborhood. A report on Steiner Ranch's $650,000 to $900,000 band tells a buyer or seller in that range far more than a single number built from everything between $538,000 and $3 million closings.
If you're weighing Steiner Ranch against another West Austin neighborhood, or trying to figure out where a specific home actually sits within its own price band, Dara Allen can walk through the segmented data for the section you're actually considering, not just the headline number attached to the ZIP code.